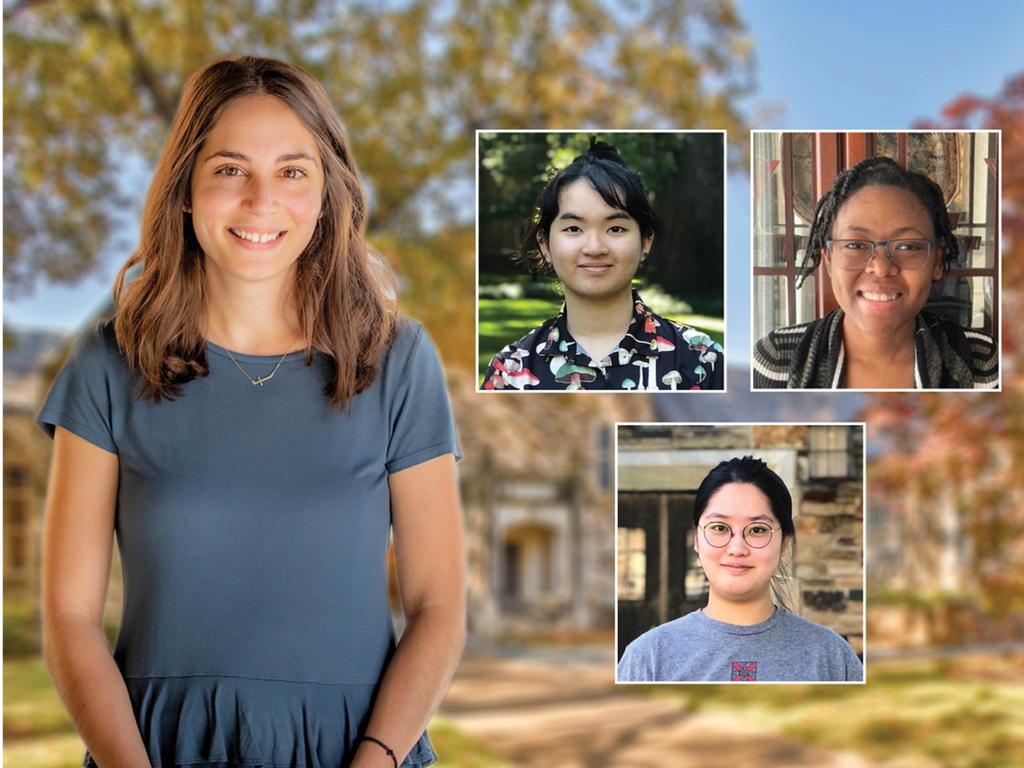
A team of three rising seniors at Rhodes College—Thu-Trang Nguyen, Jana Turner, and Jiaxuan (Jade) Yang—recently earned the second-place prize of $500 in a data visualization contest for college students presented by the National Institute of Statistical Sciences.
The Rhodes submission for the national competition was part of a midterm project in the Math 235: Data Visualization course taught by Dr. Erika David Parr in spring 2022. Students were tasked with creating innovative graphical presentations of data in public reports from the National Center for Education Statistics that would grab the attention of a wide audience and entice them to investigate more deeply the questions addressed by the data. Presentations also were designed in ways that viewers could interact with the data, such as entering their own information in boxes for comparisons or clicking on heatmaps to view certain behaviors presented by the data.
The types of data considered for the competition include rates of high school completion and bachelor’s degree attainment, mathematics achievement levels, reading score levels, and postsecondary degree attainment.
“Students came away with a view of data visualization as equally an art and a science as they answered the question of ‘What story am I choosing to tell?’ about a given dataset,” says Parr. “As their instructor and mentor for this project utilizing real-world datasets, I’m exceptionally proud of this group of students and that their work has been recognized on the national level.”
Using her interdisciplinary expertise in mathematics education and her existing partnerships with others teaching and working in data analytics, Parr redesigned the Math 235 course to implement techniques used in the data analytics industry such as Tableau, which is software for data visualization. She integrated topics such as income inequality in STEM and the HIV epidemic in Africa to explore the principles and techniques of data visualization in the context of real-world data.
Nguyen, who is a computer science major, advises other Rhodes students: “If you are interested in presenting data and learning ways that you could make the visualization not only aesthetically pleasing but also statistically accurate, I highly recommend you take the class.”
Turner, who is mathematics major and a member of the STEM Cohort Mentoring Program at Rhodes, says about the data visualization competition, “It was very interesting to be able to apply what we learned in class, and it also gave me some insight on how to work better as a team. We all understood the data in different ways, and it was helpful to determine what was going on and make conclusions that were easy to understand. This was a little difficult at first because the data was not fully clear, and there was a lot of it. However, we were able to overcome this using some of the data-wrangling tools provided to us by Dr. Parr.”
One requirement of the visualization the team developed for the competition was that it had to include a meaningful representation of standard error in the datasets. “Virtually all statistical results contain some measure of uncertainty. How to represent this uncertainty visually is emerging as a current hot topic of discussion in the world of data analytics, and there are not really clear-cut answers in the community about the best practices surrounding this issue,” says Parr. “I’m especially proud of this group of students for tackling this challenging, relevant topic.”
Yang is majoring in economics, mathematics, and computer science. She adds that her experience in the data visualization course “has been a great combination of theories and hands-on experiences” and she now feels prepared for graduate school and jobs in the field.
Parr encourages any Rhodes student interested in working with data to consider Math 235, which will be offered again in spring 2023. “Because students at Rhodes pursue a liberal arts education encompassing multiple disciplines, learning contexts, and environments and have the opportunity to grapple with multiple perspectives, they are poised to bring a diverse skill set and integrate knowledge from many fields to the data they analyze. As the world’s reliance on data increases, particularly data related to human behavior, they are uniquely positioned to engage meaningfully in this highly influential work.”
In the mathematics department at Rhodes students can take many courses that introduce them to real-world challenges and applications of mathematics, along with providing them with industry-level experience. Such courses include Math 314: Agent-based Modeling, offered by Dr. Erin Bodine, in which teams of students identify a system to model, ranging from the spread of an infectious disease to financial transactions, and work to create and implement an agent-based model to address relevant questions about the behavior of the system. The course equips students with the foundational principles of agent-based modeling and the skills to use the programming language and environment NetLogo. Math 235 is included in the statistics minor coursework as an elective, but students from any degree program are encouraged to enroll in the course.
“One of the reasons I chose Rhodes was the opportunity to teach and mentor students, both in their mathematics coursework and outside the classroom,” says Parr. “I am grateful for the support of my fellow mathematics faculty to bring innovative teaching to Rhodes in this course and to have mentored these students. The results of this competition have signaled that our students, especially those from groups underrepresented in STEM, have a seat at the table in current, pressing challenges that will require deep mathematical and technical skills coupled with careful, critical thought. This is but another example of the meaningful experiences our mathematics students are receiving beyond the classroom and their demonstrated excellence—in this case, on a national level.”
To learn more about mathematics at Rhodes, visit here.
